
Trend analysis of cane crushed and sugar production in Bihar
DOI:
https://doi.org/10.31783/elsr.2022.81141145Keywords:
cane crushed, R2, statistical model, sugar production, trend analysisAbstract
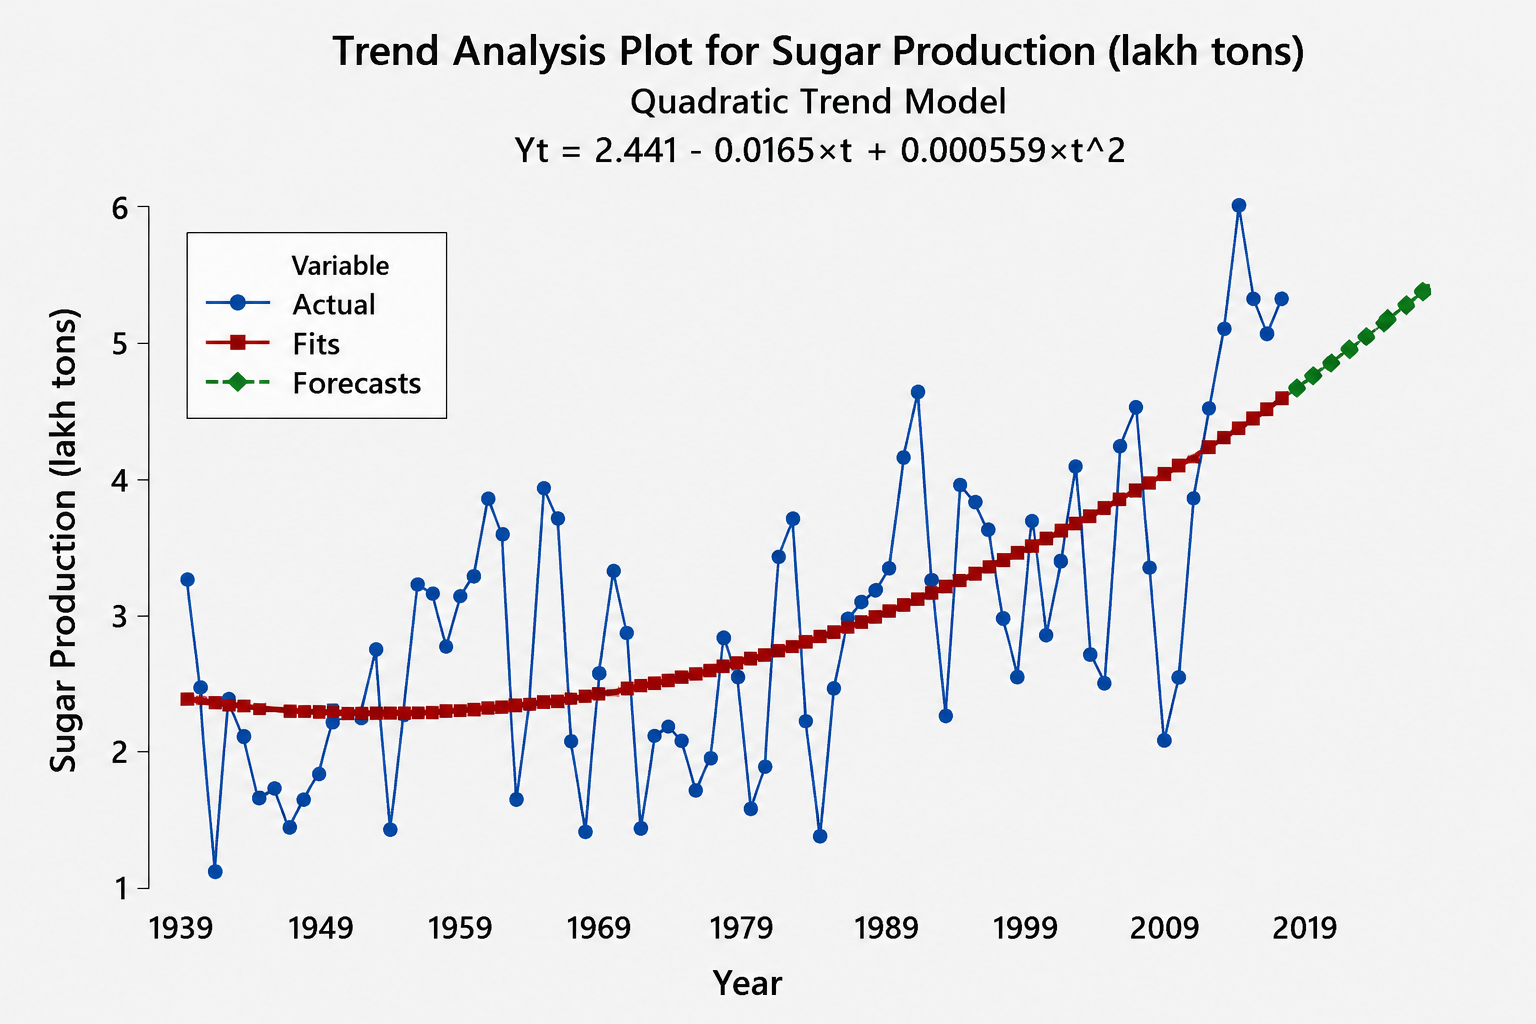
The goal of this study was to look at the trends in Bihar's cane crushing and sugar production. From 1939 to 2016, time-series data on cane crushed and sugar production was used (78 years). For this reason, three trend analysis models were used: linear, exponential, and quadratic, with the quadratic trend model being the best fit for the current study's trend analysis. A model was considered better if it processed low values of MAPE, MAD, and MSD and high values of R27 and R28. It was suggested that forecasted values have a positive increasing trend and are very close to that of actual values in Bihar as the next coming ten years are showing a good picture of sugar production. The result revealed that using the established model, it is possible to see that anticipated cane crushed and sugar production has constantly increased trends for the next ten years, from 2017 to 2026. The percentage increase in cane crushed ranged from 1.41 to 1.44 during 2017-26. The percentage increase in sugar production ranged between1.42 to1.68 during 2017-26. Farmers are becoming more interested in producing sugarcane in their fields as a result of the excellent profits it provides. These estimates will aid in the formulation of sound policies in Bihar's sugar and cane crushing industries.
References
[1] GOI (2016). Agricultural statistics at a glance, Directorate of Economics and Statistics.
[2] S. Batool, N. Habib, M. Nazir, S. Siddiqui and S. Ikram (2015). Trend Analysis of Sugarcane Area and Yield in Pakistan. Sci. Technol. Dev., 34: 46-48.
[3] V. K. Boken (2000). Forecasting spring wheat yield using time series analysis. Agron. J., 92: 1047-1053.
[4] R. Finger (2010). Evidence of slowing yield growth- The example of Swiss cereal yield. Food Policy, 35:175-182.
[5] N. Habib, M. Z. Anwer, S. Siddiqui, S. Batool and S. Naheed (2013). Trend analysis of Mungbean area and yield in Pakistan. Asian J. Agric. Rural Dev., 3: 909-913.
[6] M. R. Karim, M. A. Awal and M. Akter (2010). Forecasting of wheat production in Bangladesh. Bangladesh J. Agril. Res., 35: 17-28.
[7] S. H. Rahman, R. H. Rimi, S. Karmarkar and S. G. Hussain (2009). Trend analysis of climate change and investigation on its probable impacts on rice production at Sathkhira, Bangladesh. Pak. J. Meteorol., 6: 37-50.
[8] K. K. Suresh and S. R. K. Priya (2011). Forecasting sugarcane yield of Tamilnadu using ARIMA models. Sugar Tech, 13: 23-26.
[9] P. F. Khaemba, P. W. Muiruri and T. N. Kibutu (2021). Trend Analysis in Sugarcane Growth in Mumias Sugar Belt, Western Kenya; for the period 1985-2015, Interdiscip. J. Rural and Community Studies, 3: 31-40.
[10] K. P. Vishawajith, P. K. Sahu, B. S. Dhekale and P. Mishra (2016). Modelling and Forecasting Sugarcane and Sugar Production in India. Indian J. Econ. Dev., 12: 71-80.
[11] T. O. Kvalseth (1985). Cautionary note about R2. Am. Stat., 39: 279-285.
[12] M. Yaseen, M. Zakria, I.-U.-D.-Shahzad, M. I. Khan and M. A. Javed (2005). Modelling and forecasting the sugarcane yield of Pakistan. Int. J. Agri. Biol., 7: 180-183.
Downloads
Published
Issue
Section
License
Copyright (c) 2022 Author (s)

This work is licensed under a Creative Commons Attribution-NonCommercial-NoDerivatives 4.0 International License.
Copyright © The Author(s). This is an open access article distributed under the terms of the Creative Commons Attribution-NonCommercial-NoDerivatives 4.0 International License (CC BY-NC-ND 4.0), which permits unrestricted non-commercial use, distribution, and reproduction in any medium, provided the original author(s) and source are properly credited, and the work is not modified or adapted.