Application of principal component analysis for rice f5 families characterization and evaluation
DOI:
https://doi.org/10.7324/ELSR.2018.417284Keywords:
D2 statistic, genetic divergence, principal component analysisAbstract
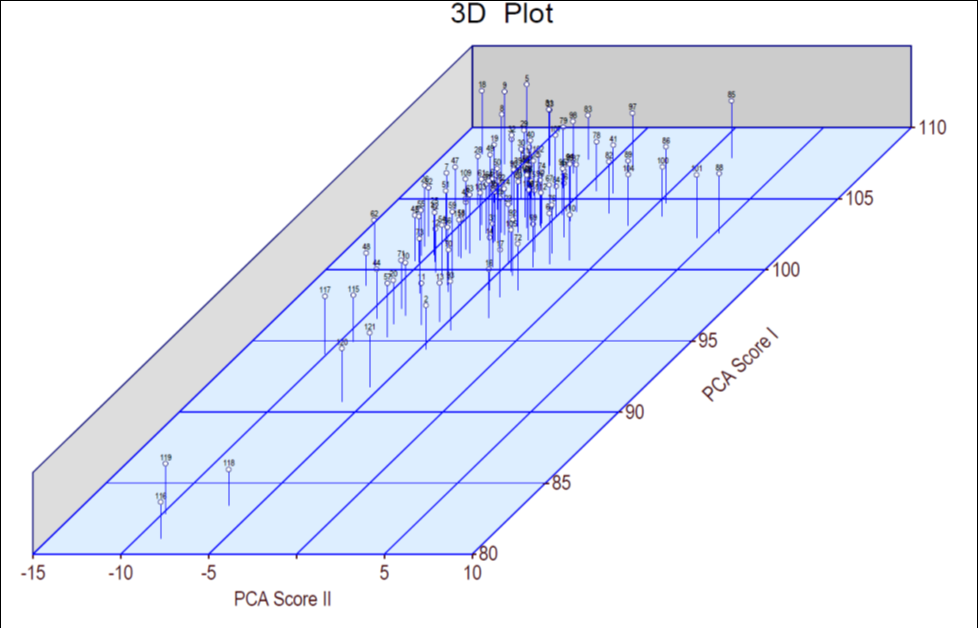
The type and level of genetic variance in one hundred and fourteen F5 families of rice obtained from six different crosses was estimated along with their seven parents using Mahalanobis D2 – statistics by considering 10 characters. Mahalanobis D2 analysis revealed considerable amount of diversity in the material. The genotypes were grouped into twelve clusters. Cluster IX constituted maximum number of genotypes (26). The genotypes falling in cluster VII had the maximum divergence, which was closely followed by cluster VIII and cluster XI. The maximum inter cluster D2 values was observed between cluster X and XI (931.276) followed by cluster VIII and XI (814.784) suggesting that the genotypes constituted in these clusters may be used as parents for future hybridization programs. Principal component analysis revealed that families MTU 2462-1-5-2, MTU 2462-15-1-1, MTU 2468-30-2-2, MTU 2468-29-3-1, MTU 2462-1-9-2, MTU 2469-23-2-1, MTU 2469-6-2-1, MTU 2469-36-1-1, MTU 2469-32-2-1 were more divergent and hence, can be used in breeding programs. Hence, the results of cluster analysis were supported by principal component analysis.
References
[1] J. Biouf (2003). Rice is life. International Rice Commission News Letter. 52: 3.
[2] P. C. Mahalanobis (1928). A statistical study at Chinese head measurement. Journal of Asiatic Society of Bengal. 25: 301-307.
[3] C. R. Rao (1952). Advanced statistical methods in biometric research.
[4] B. K Senapati and G. Sarkar (2005). Genetic divergence in tall indica rice under rainfed saline soil of Sundarban. Oryza. 42: 70-72.
[5] R. K. Singh and B. D. Chaudhary (1979). Biometrical methods in quantitative genetic analysis. Biometrical methods in quantitative genetic analysis.
[6] S. Yadav, A. Singh, M. R. Singh, N. Goel, K. K. Vinod and T. Mohapatra et al. (2013). Assessment of genetic diversity in Indian rice germplasm (Oryza sativa L.): use of random versus trait-linked microsatellite markers. J. Genet., 92: 545-557.
Downloads
Published
Issue
Section
License
Copyright (c) 2018 Author (s)

This work is licensed under a Creative Commons Attribution-NonCommercial-NoDerivatives 4.0 International License.
Copyright © The Author(s). This is an open access article distributed under the terms of the Creative Commons Attribution-NonCommercial-NoDerivatives 4.0 International License (CC BY-NC-ND 4.0), which permits unrestricted non-commercial use, distribution, and reproduction in any medium, provided the original author(s) and source are properly credited, and the work is not modified or adapted.